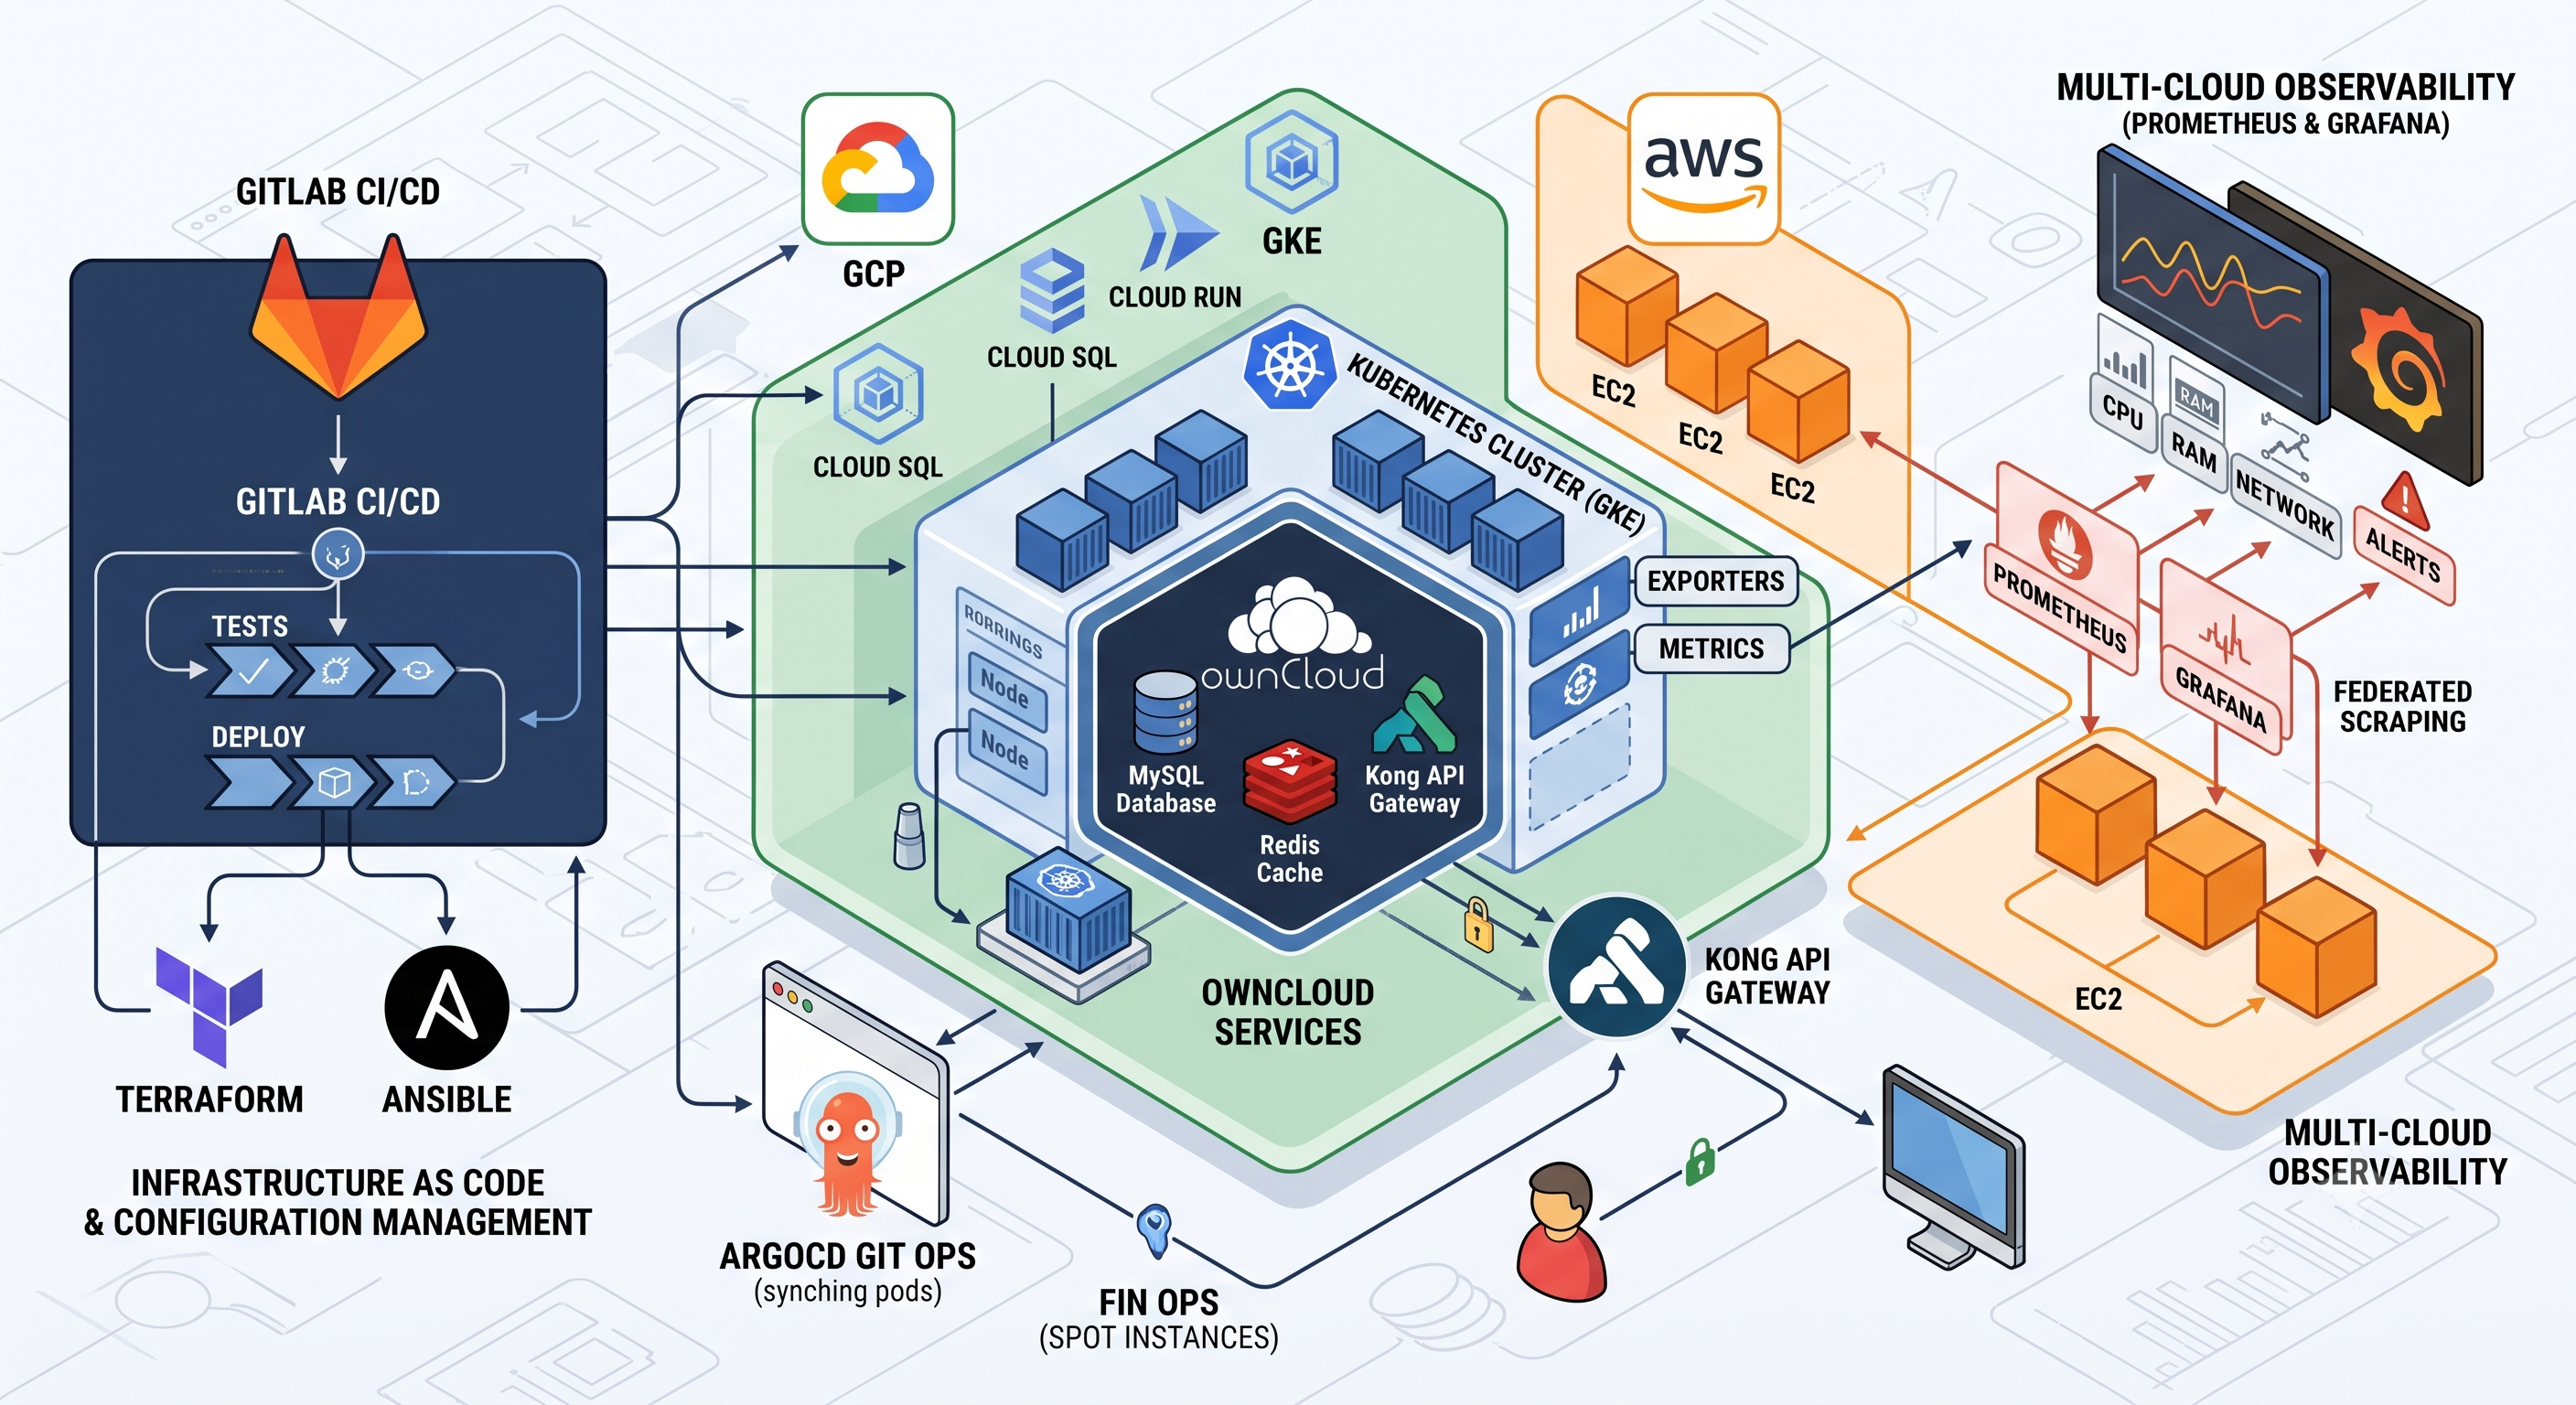
Owncloud - Open Source Storage Solution
Deployment of an open-source file storage application, OwnCloud, on a resilient and highly available multi-cloud GCP & AWS infrastructure.
🚀 GitOps & Multi-Cloud Architecture: Automated Deployment of a Resilient OwnCloud Infrastructure
Welcome to this new KernelLab publication! Today, I invite you to take a deep technical dive into a complete infrastructure project: the highly available deployment of an OwnCloud solution. The goal of this project was to design an architecture capable of 24/7 availability for global users, with a strong focus on GitOps automation, security (SecOps), and cost optimization (FinOps).
To get into the engineering details, I have broken down this article into several strategic areas, from network design to federated observability.
🏗️ Multi-Cloud Architecture: Choosing Resilience
To ensure maximum fault tolerance and avoid a Single Point of Failure tied to a single provider, the infrastructure was designed using a Multi-Cloud approach. This strategic decoupling separates the execution environment from its monitoring system.
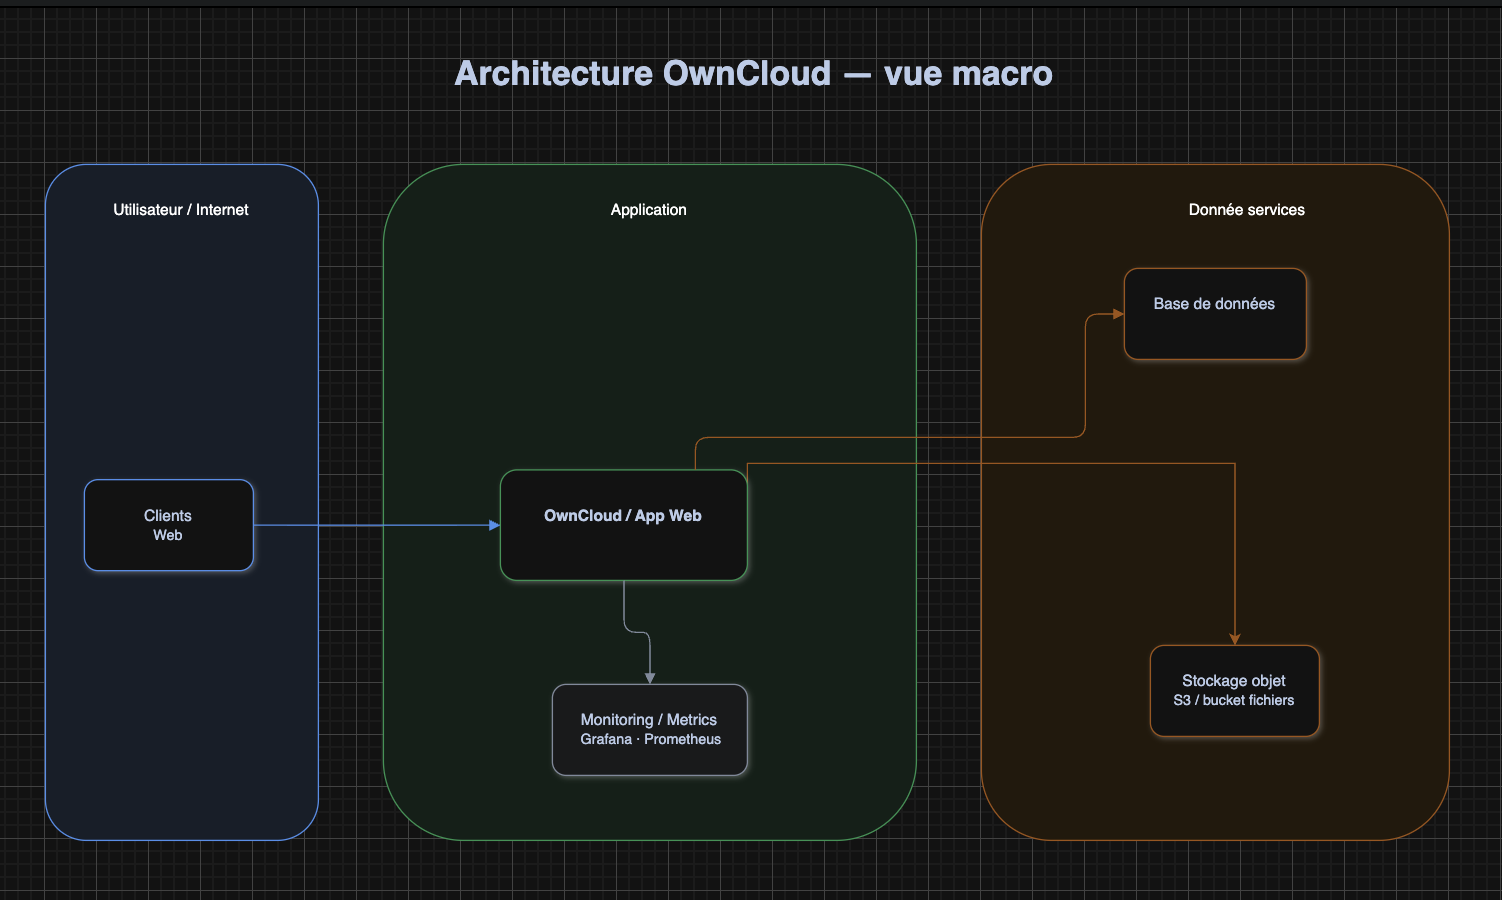 (Macro/Mezzo architecture diagram detailing network flows and service distribution)
1. Google Cloud Platform (GCP): The Application Foundation
All application workloads are hosted on Google's infrastructure, distributed as follows:
- Google Kubernetes Engine (GKE): Orchestration relies on a Standard GKE cluster (non-Autopilot). This choice gives us full control over resource allocation and enables the use of Spot instances (e2-standard-2) to massively optimize costs.
- Databases & Cache: Persistent data rests on Cloud SQL (managed MySQL), guaranteeing elastic scalability and automated external backups (7-day retention). For temporary storage, Redis is deployed directly in-cluster for performance and cost reasons.
- Serverless Workloads: Our internal CI analysis component (built with FastAPI/Python) runs on Cloud Run and interacts with Artifact Registry, taking advantage of pure pay-per-use billing.
2. Amazon Web Services (AWS): The Observability Island
Monitoring is intentionally isolated on AWS to ensure independent alerting in the event of a major failure of the primary cluster.
- EC2 Compute Infrastructure: Deployment of a t3.medium instance allocated to Prometheus (to meet its RAM demands) and a t3.small instance for Grafana (the Go language allowing a very small memory footprint).
- Isolated Network: Instances operate in a dedicated VPC with an Internet Gateway and strict hardening via Security Groups (allowing port 22 for restricted administration).
⚙️ Infrastructure as Code (IaC) & Configuration Management
The entire lifecycle of resources is driven by code to ensure immutability and reproducibility. No more manual configuration or configuration drift.
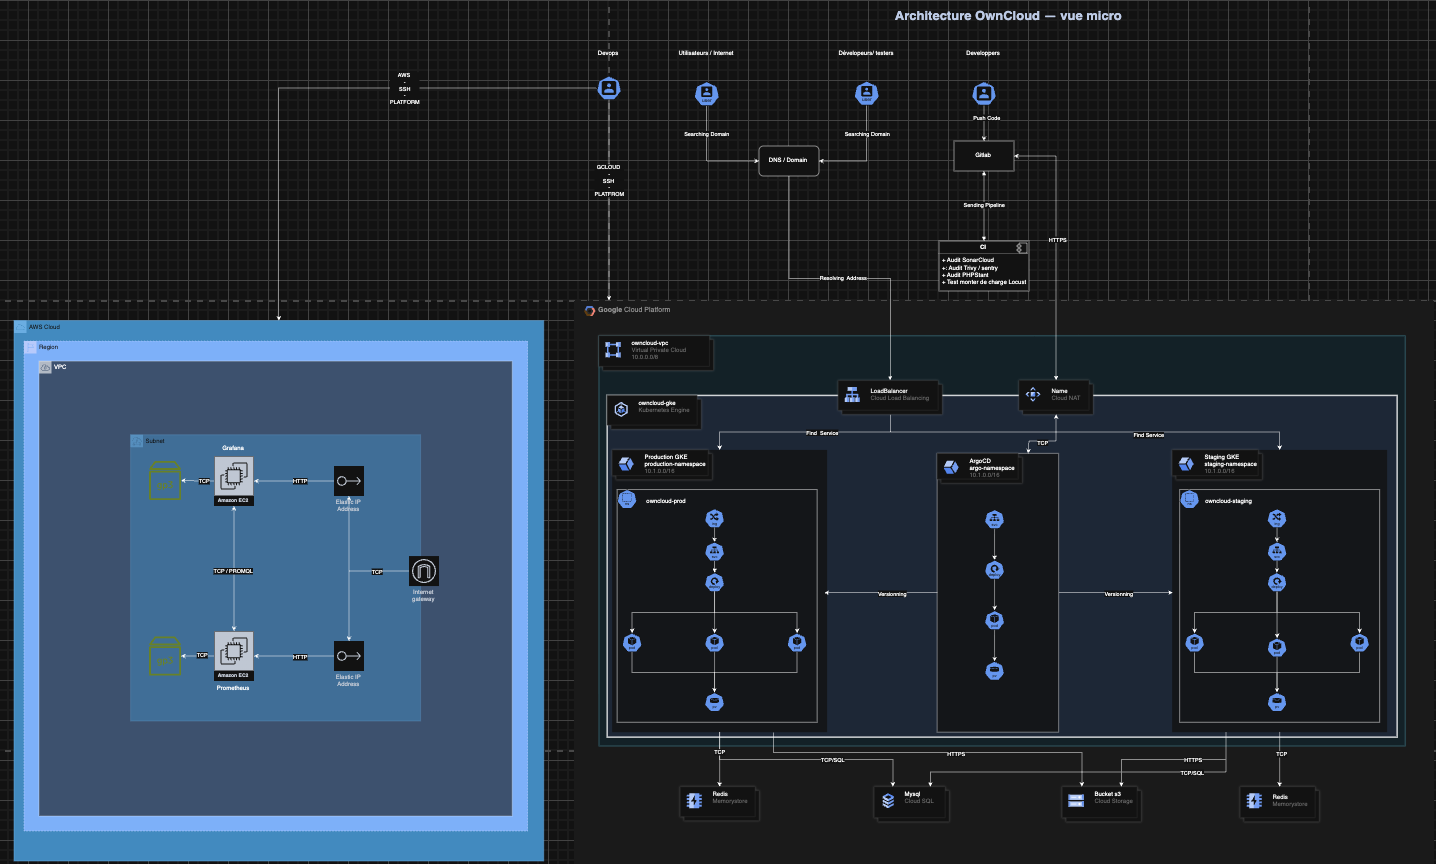 (Micro view of pipelines and provisioning)
1. Multi-Provider Provisioning with Terraform
The GitOps approach starts right at the infrastructure layer:
- Validation CI Pipeline: Every modification to the Terraform code triggers validation (
fmt,validate) and planning (plan) jobs accessible across all Git branches. - Controlled Deployment: Modification execution (
apply) is strictly contingent on manual validation and only allowed on the main branch (main). - State Security: The infrastructure's remote state is secured in a GCP bucket (Cloud Storage) with a state lock mechanism to prevent any corruption during collaborative work.
2. Post-Deployment Harmonization with Ansible
Once the servers are provisioned, Ansible takes over to standardize the OS:
- Idempotent Playbooks: Installing prerequisites (Docker, system dependencies) for our monitoring tools (Grafana/Prometheus).
- CI Hardening: Deployment relies on a single repository. The SSH keys required to connect to AWS instances are securely injected as Base64-encoded variables in GitLab CI.
🔄 Software Factory (CI/CD) & The GitOps Approach
The automation of our deployments relies on GitLab Workflow and ArgoCD, making Git the single source of truth.
1. Continuous Integration (GitLab CI) & "Shift-Left"
Our software pipeline is divided into several critical steps to ensure deliverable quality before even thinking about production:
- Testing & Quality Phase: Strict static analysis via PHPStan, vulnerability detection and technical debt management with SonarCloud, and functional validation with PHPUnit.
- Build & Push: Generation of the OwnCloud Docker image compiled from source, then persisting the artifact to the GitLab Container Registry.
- Manifest Updates: A CI job automatically updates the new image SHA in our dedicated Kubernetes manifests Git repository.
2. Continuous Deployment with ArgoCD
Rather than "pushing" modifications to the cluster, the cluster synchronizes its state with Git.
(ArgoCD interface ensuring workload synchronization: Kong, Redis, OwnCloud, Cert-Manager)
- Automated Synchronization: ArgoCD, deployed via Helm, constantly monitors our repository. As soon as a change is detected (new image tag, config modification), it synchronizes the GKE cluster.
- Traceability and Reversibility: Since all history is versioned, rolling back to a previous stable version is instantaneous in case of a production anomaly.
📊 Observability: Federating for Better Proactivity
Our monitoring strategy relies on CNCF standards, with an architecture designed for resilience.
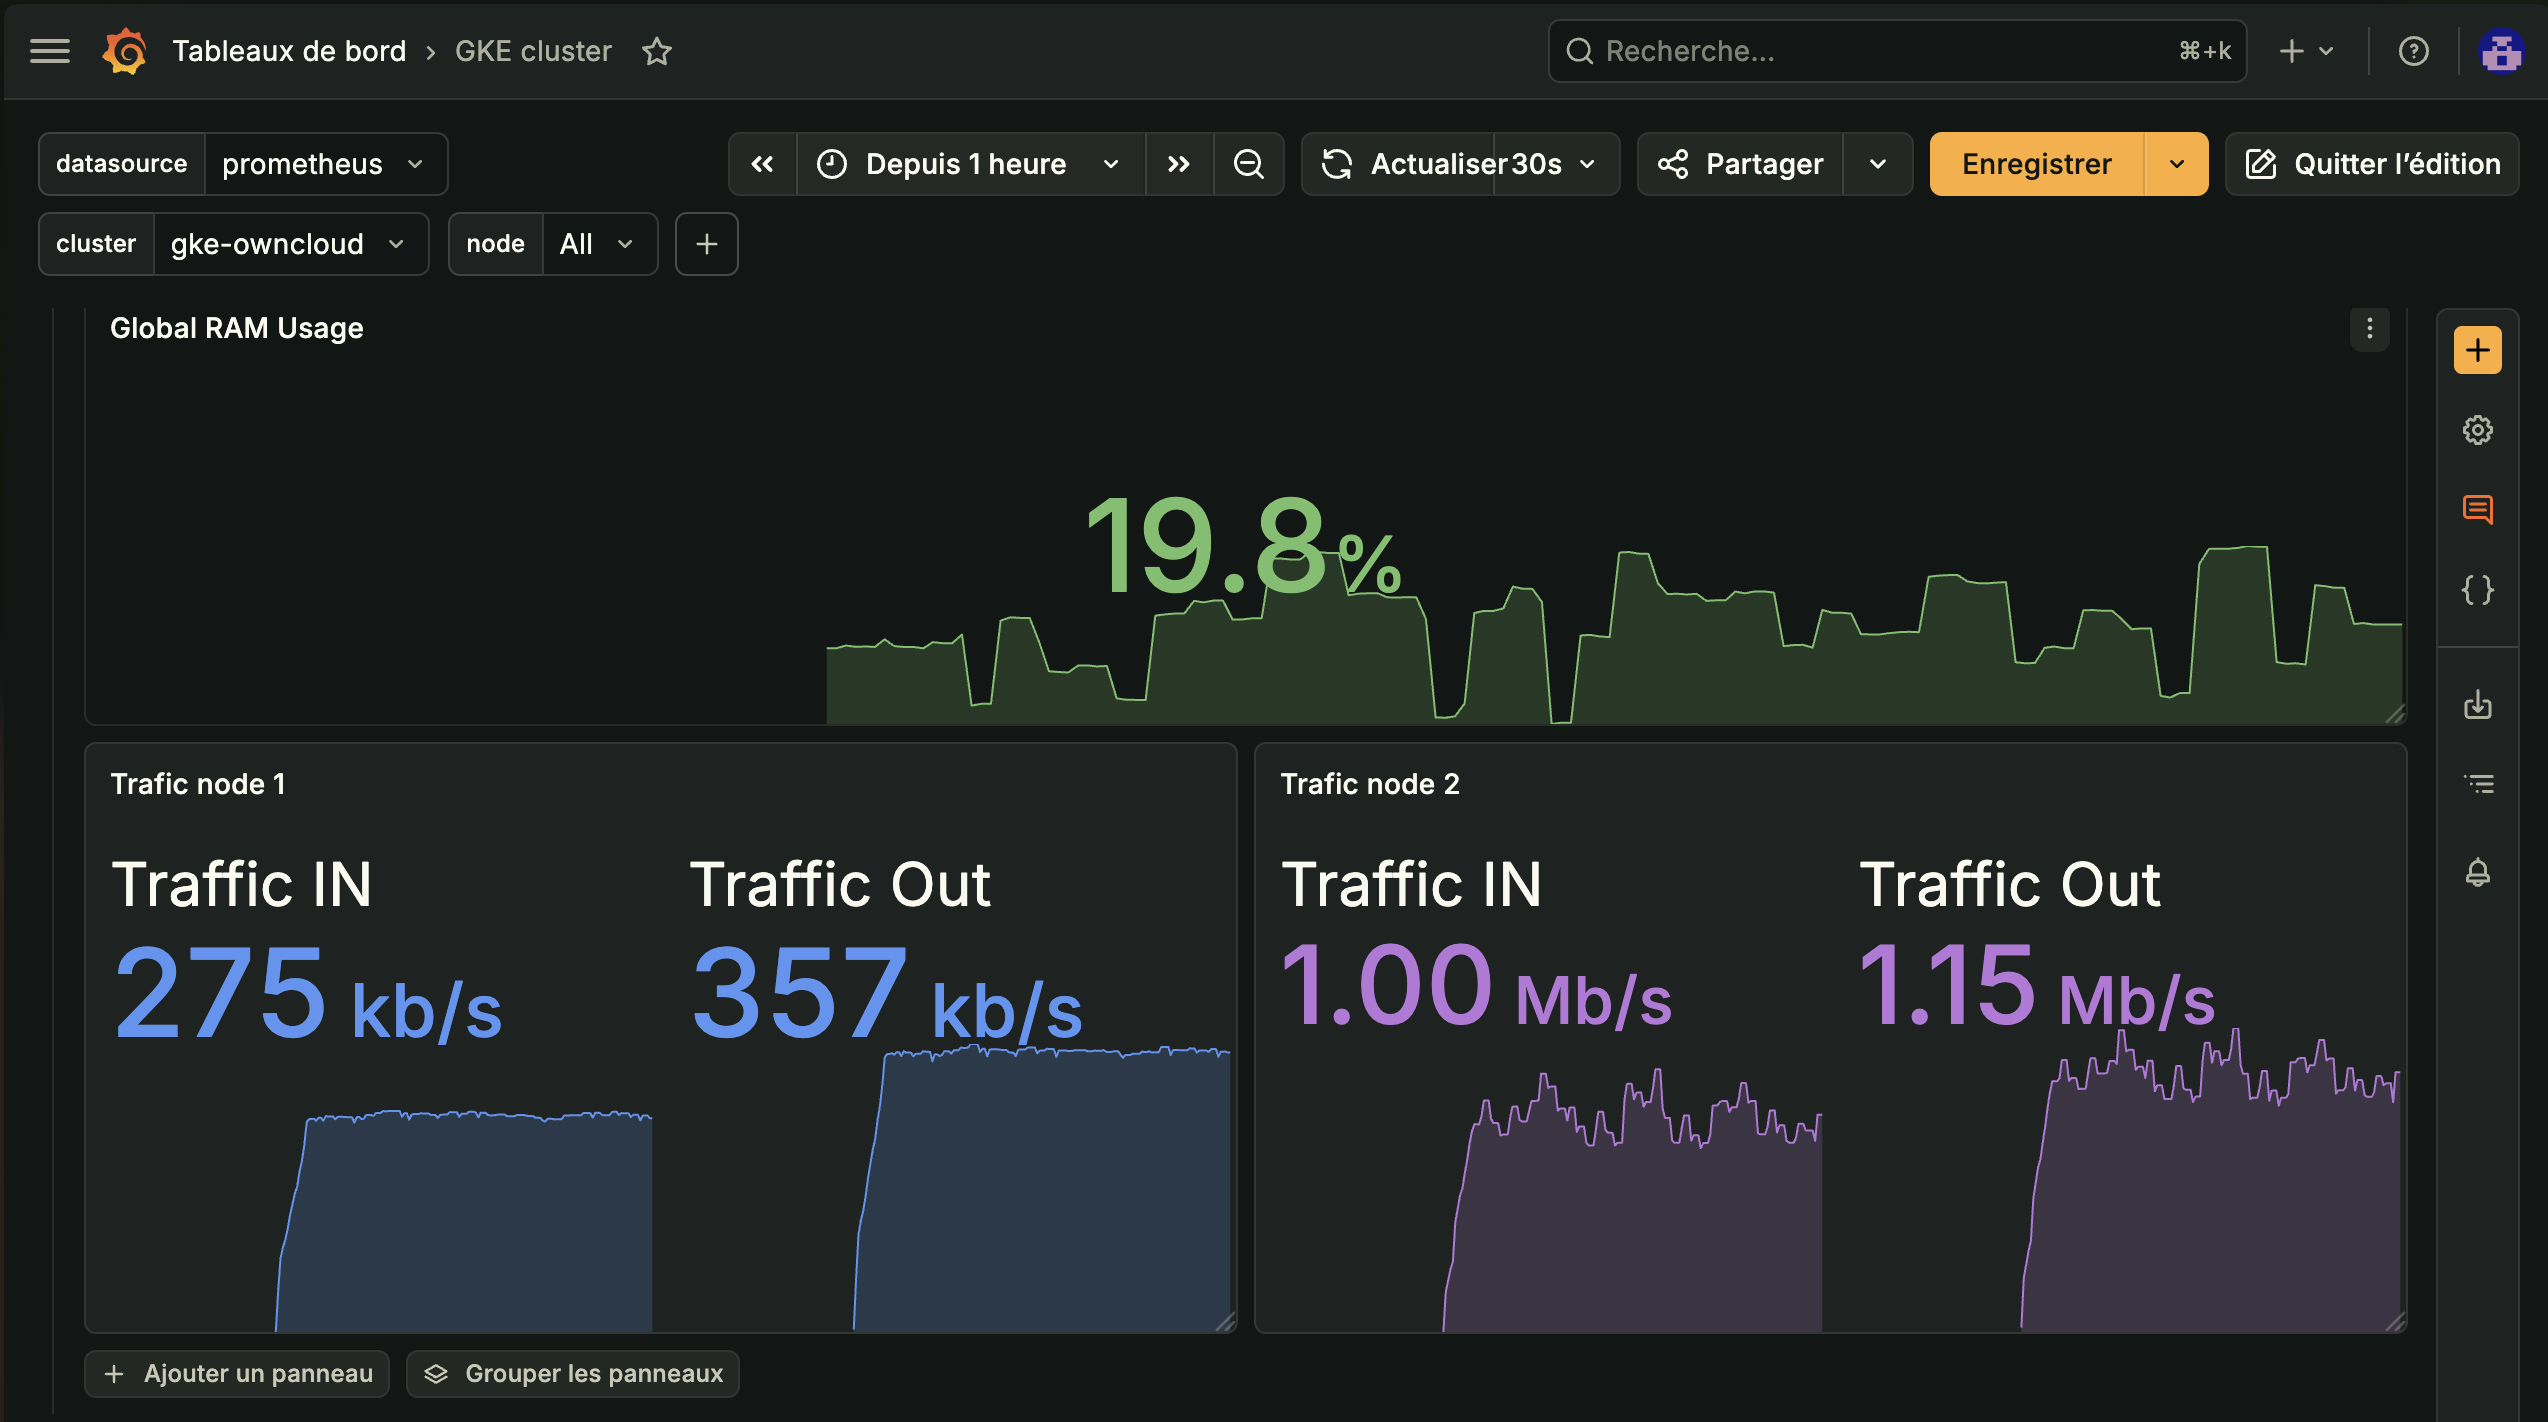 (Grafana Dashboard: Monitoring GKE Pod states, memory saturation, and network traffic)
1. Federated Prometheus Architecture
- Local Collection (GCP): A primary Prometheus agent is deployed in-cluster on GKE to automatically scrape metrics from our workloads (Pods, Nodes).
- External Centralization (AWS): A second external Prometheus instance queries the GCP agent. This separation ensures data is neither altered nor lost in the event of a total Kubernetes cluster crash.
2. Dynamic Control with Grafana
- Visual Analytics: Creation of granular dashboards to observe node CPU/RAM consumption, In/Out network traffic, and container health (Running, Pending, Failed) in real time.
- Proactive Alerting: Configuration of critical thresholds generating automatic notifications (via SMTP and Discord Webhooks) to alert teams before users experience slowness.
💰 FinOps & Security (SecOps)
An elegant architecture must also be cost-effective and deeply secure.
1. Cost Management (FinOps Approach)
- Database Trade-Offs: Deploying Redis as an in-cluster container saves at least €25/month compared to a managed cloud offering.
- Compute Optimization: Choosing Standard GKE over Autopilot, combined with Spot instances, significantly reduces the GCP bill (around 20-30% savings).
- Monitoring Hosting: AWS EC2 instances proved 10-15% more cost-effective than GCP equivalents for the workload profile of our observability tools.
2. Access Hardening (SecOps)
- Identity Access Management (IAM): Strict application of the principle of least privilege. Every resource (Terraform, Cloud Run, EC2) only holds the exact IAM rights or Service Accounts required for execution.
- Controlled Exposure: Public access to the OwnCloud application goes through Kong API Gateway (deployed inside GKE) which handles TLS termination (HTTPS) and application routing. This choice anticipates the Kubernetes Gateway API standard, which is more robust than traditional Ingresses.
- Digital Identity: Sovereign usage of OVHCloud for DNS management and business SMTP server implementation ensures full control over communication flows and budget.
🚀 Future Perspectives and Improvements
This project tangibly demonstrates the agility offered by the Cloud Native ecosystem. Combining Terraform, Kubernetes, and a GitOps workflow under ArgoCD provides essential deployment peace of mind in production environments.
However, infrastructure is a living product. Next iterations include:
- Advanced SecOps: Integrating Trivy into our CI pipelines for upstream Docker image vulnerability scanning, and implementing an administration Bastion host on the AWS VPC to eliminate public SSH access to EC2 instances.
- Predictive Observability: Fine-tuning Grafana alert thresholds and directly leveraging the Prometheus UI.